Concept build, live demo, 2026

Pulse

Pulse answers the question every dashboard leaves open: revenue dropped, but why? It reads a company's orders, customers, payments and support tickets, spots what changed, and explains it in plain language, with every number coming from the database rather than from the AI.

Open the live demo

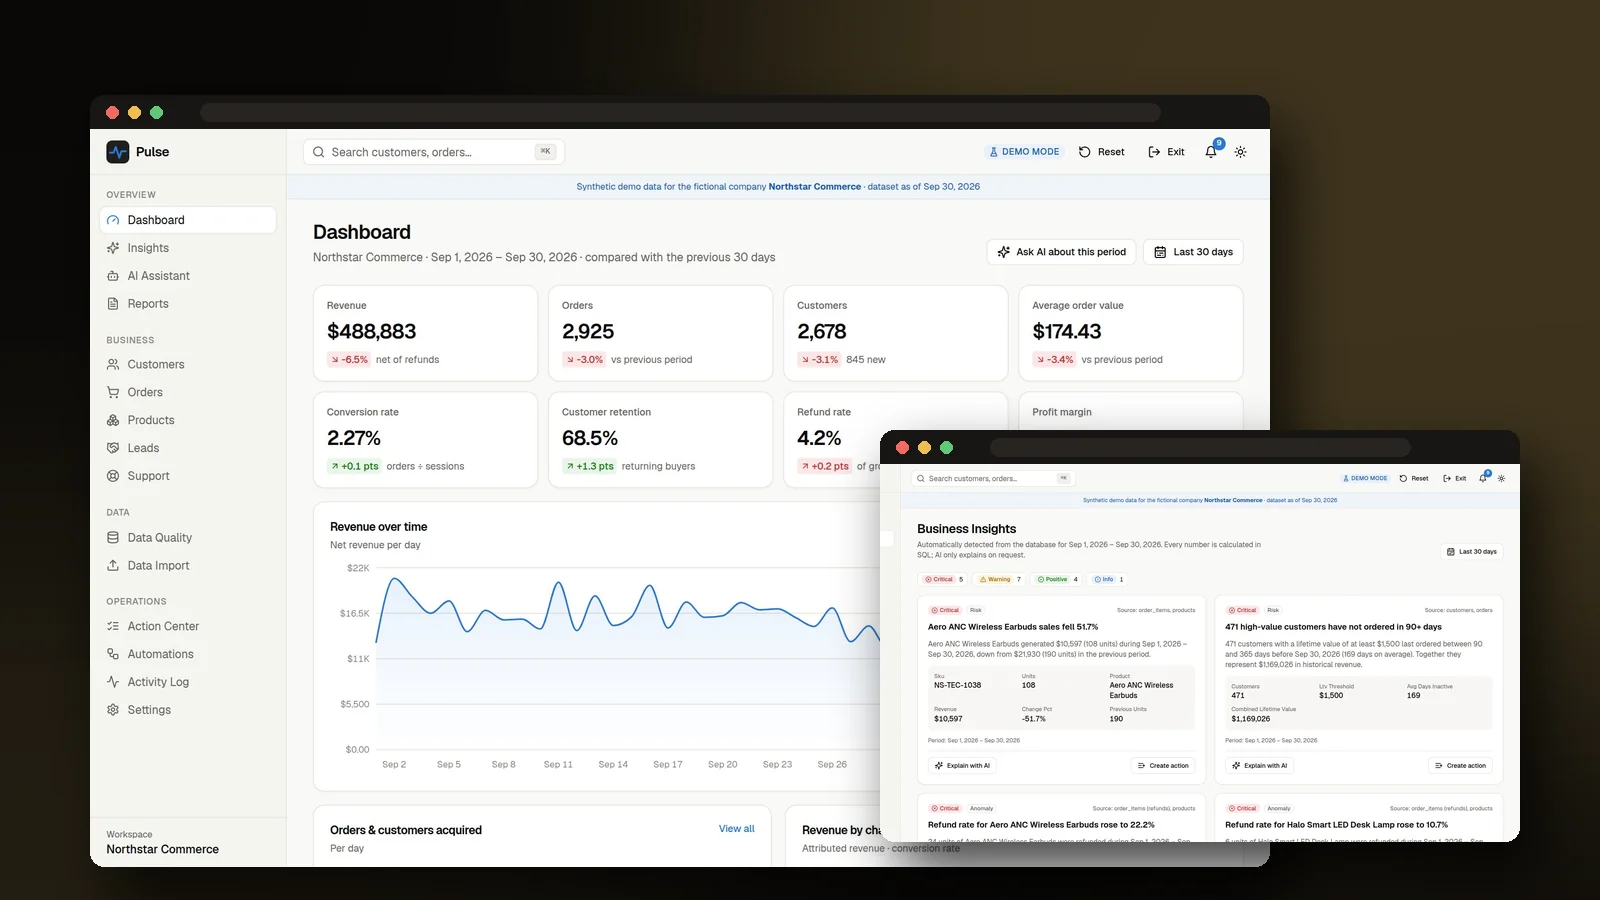
Pulse analytics dashboard with revenue, orders and conversion KPIs, and the Business Insights page in a second window
65,000+orders in the synthetic demo company
17typed analytics tools the AI can call
13detectors that find insights on their own

The problem

Most businesses have the data but not the answers. Sales sit in one system, payments in another and support in a third, with duplicates, mixed date formats and five spellings of the same country.

A normal dashboard shows that revenue fell. It does not say which category, which channel or which customers caused it, so someone spends a day in spreadsheets to find out.

Adding a chatbot on top usually makes it worse. A language model will happily invent a number that sounds right, and a business cannot act on that.

What I built

  • 01

    Analytics in the database

    About 30 SQL functions compute every KPI, trend, funnel and retention cohort directly in Postgres, under row level security. Revenue is defined once, so every breakdown adds up to the headline number.

  • 02

    Insights that find themselves

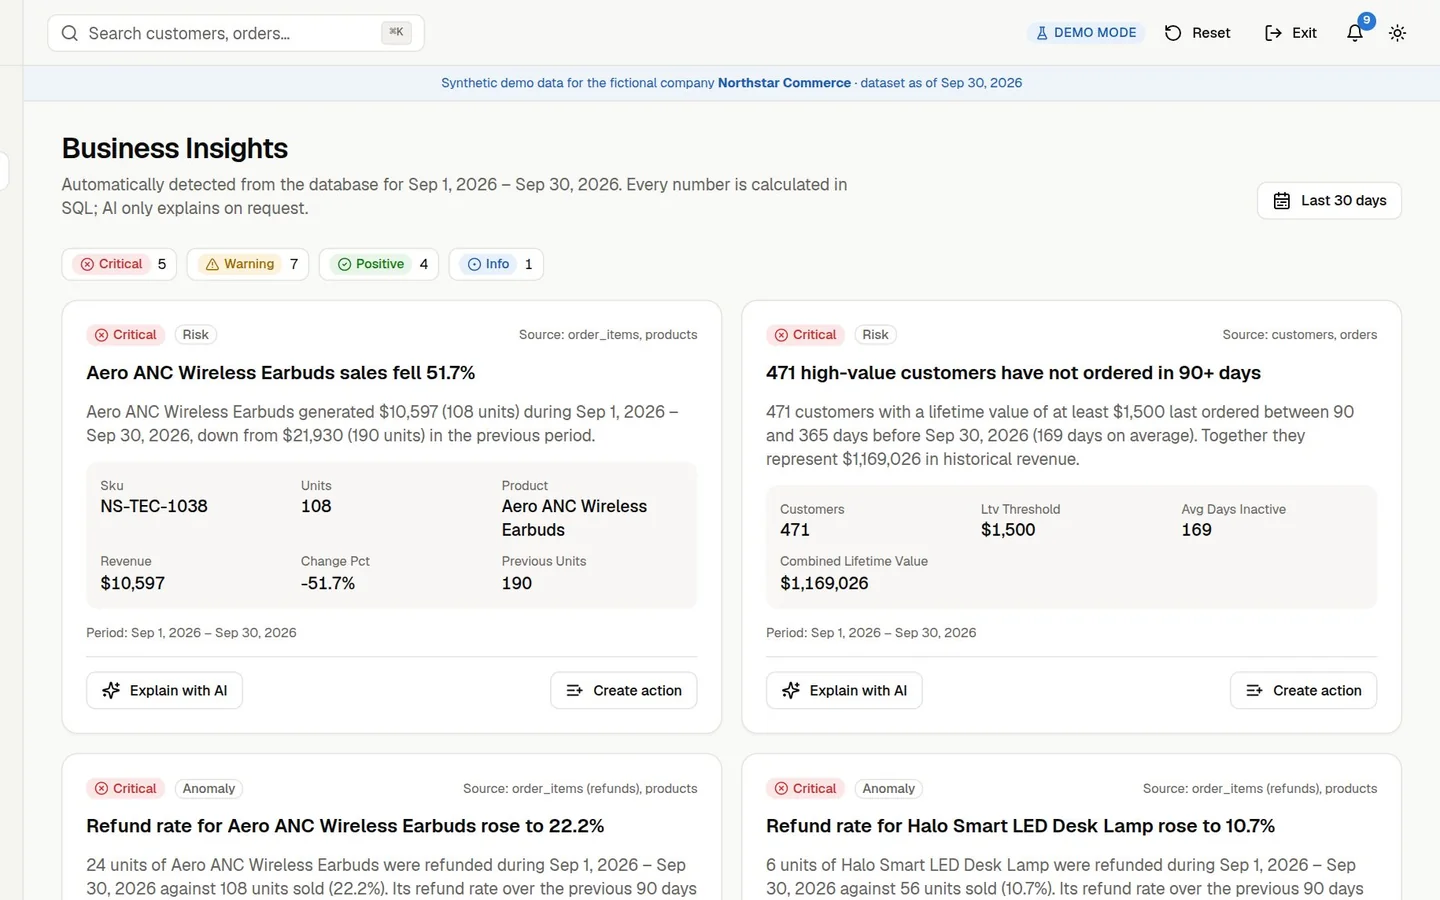
    13 generic detectors look for category declines, refund spikes, payment failures, inactive VIPs and more. They are not told about the ten stories planted in the demo data. They find them.

  • 03

    An assistant that cannot make numbers up

    The AI can only call 17 whitelisted analytics tools with validated arguments. The cards, tables and charts in its answers are built from those tool results, never from the model's text.

  • 04

    Clean data in, actions out

    A Data Quality Center that scans 17,000 raw records from four sources and cleans them, a CSV importer that maps and validates columns, and an Action Center fed by six automation rules that run inside Postgres.

Key features

  • Executive dashboard with 8 KPIs and period comparison
  • 13 detectors that find problems in the data on their own
  • AI assistant answering through 17 typed analytics tools
  • Explain with AI on any finding, grounded in the numbers
  • Data Quality Center that scans and cleans 17,000 raw records
  • CSV import with automatic column mapping and validation
  • Automations that run inside Postgres, each run logged
  • Public demo with a private session for every visitor

The hard part

Making the AI trustworthy. The model never writes SQL and never supplies a number. It chooses tools, each tool runs a fixed, parameterised SQL function under the visitor's own permissions, and the figures on screen come straight from those results. If a model cannot call tools, a keyword planner fetches the data instead, and if the provider fails, the page still shows the data it already has. The other hard part was the public demo: every visitor gets an anonymous, isolated session, so they can create actions, notes and reports without seeing anyone else's, and Reset wipes only what they made.

Where it stands

Live as a public demo at pulse.ninga.dev. Anyone can open a private session on Northstar Commerce, a fictional outdoor retailer with about 25,600 customers and ten business stories hidden in its data, and ask the assistant what is going on. The same schema already supports real organisations, roles and row level security, so the engine can be pointed at a client's own sales, orders and support data.

Video walkthrough

Screens

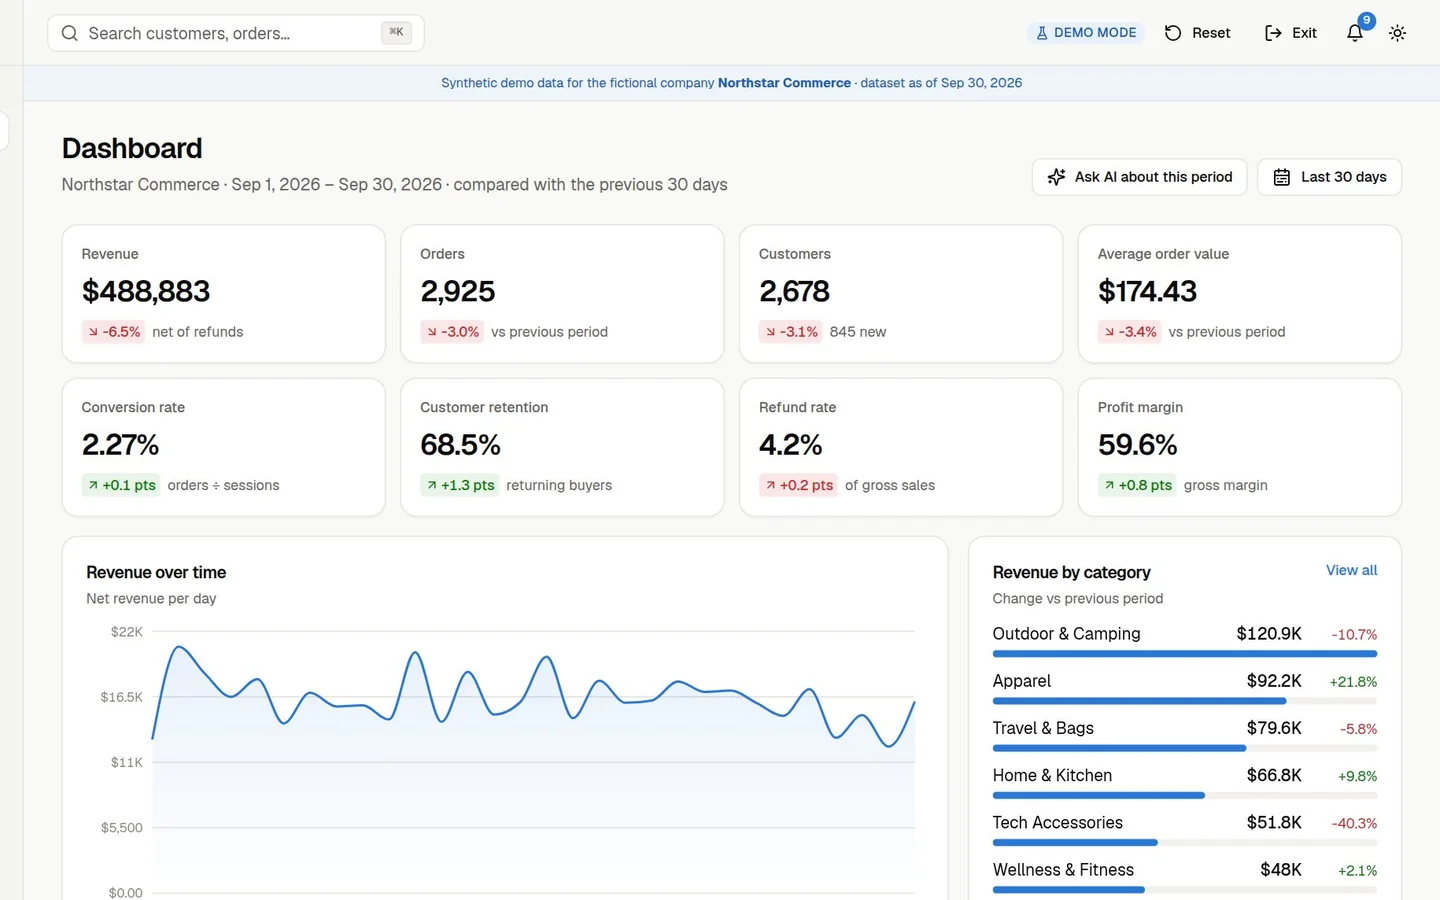
Pulse dashboard with revenue, orders, customers, average order value, conversion, retention, refund rate and margin KPIs above a revenue chart and revenue by category
The executive dashboard
Pulse Business Insights page with critical findings such as Aero ANC Wireless Earbuds sales fell 51.7% and a refund rate rising to 22.2%, each with an Explain with AI button
Insights found automatically, with Explain with AI
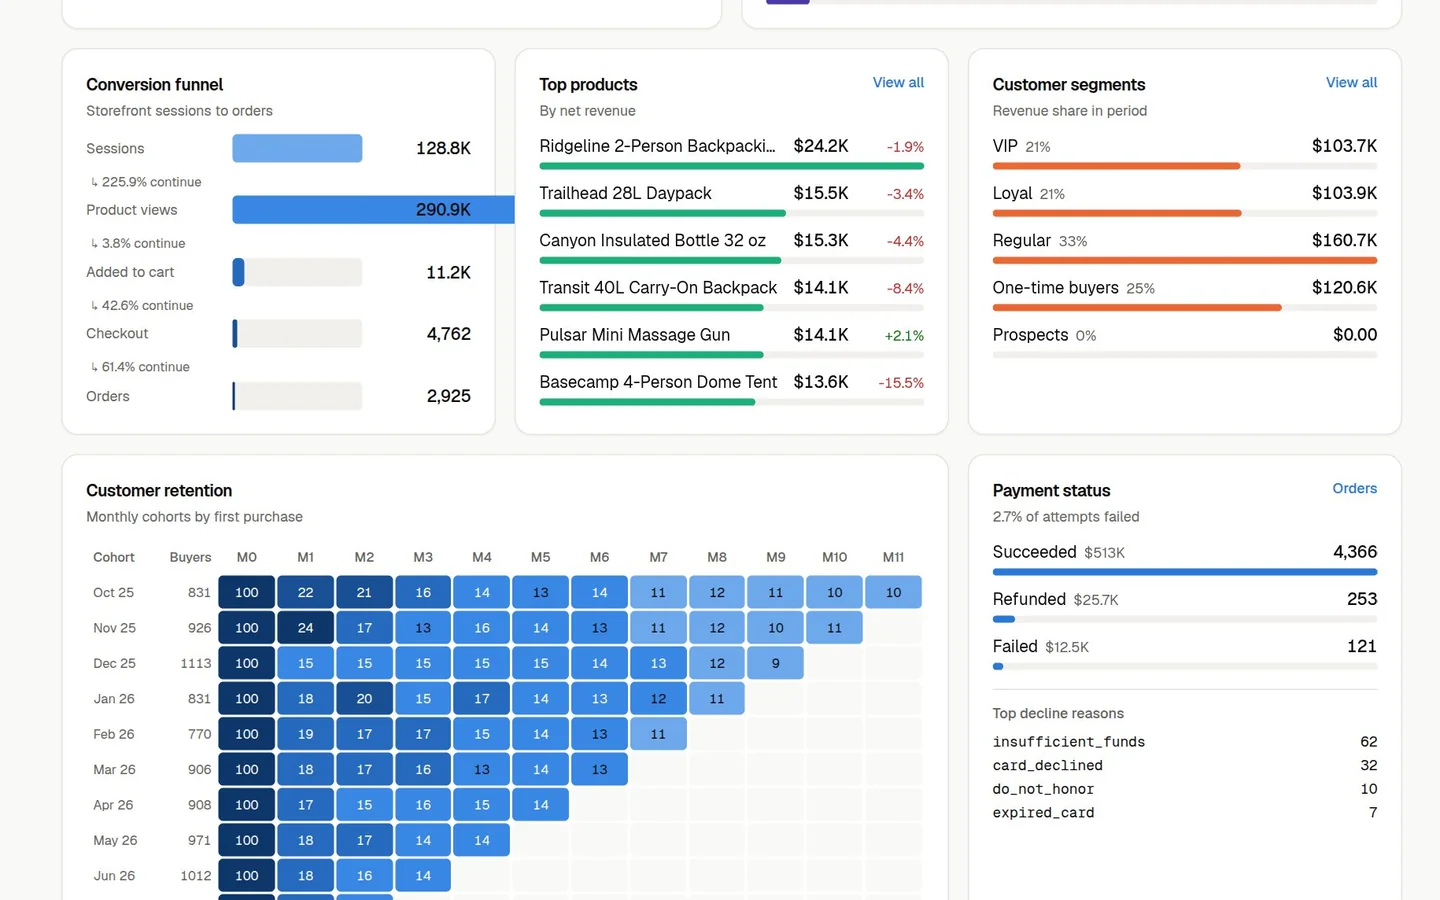
Pulse conversion funnel from sessions to orders, top products, customer segments, a monthly retention cohort grid and payment status
Funnel, top products and retention cohorts
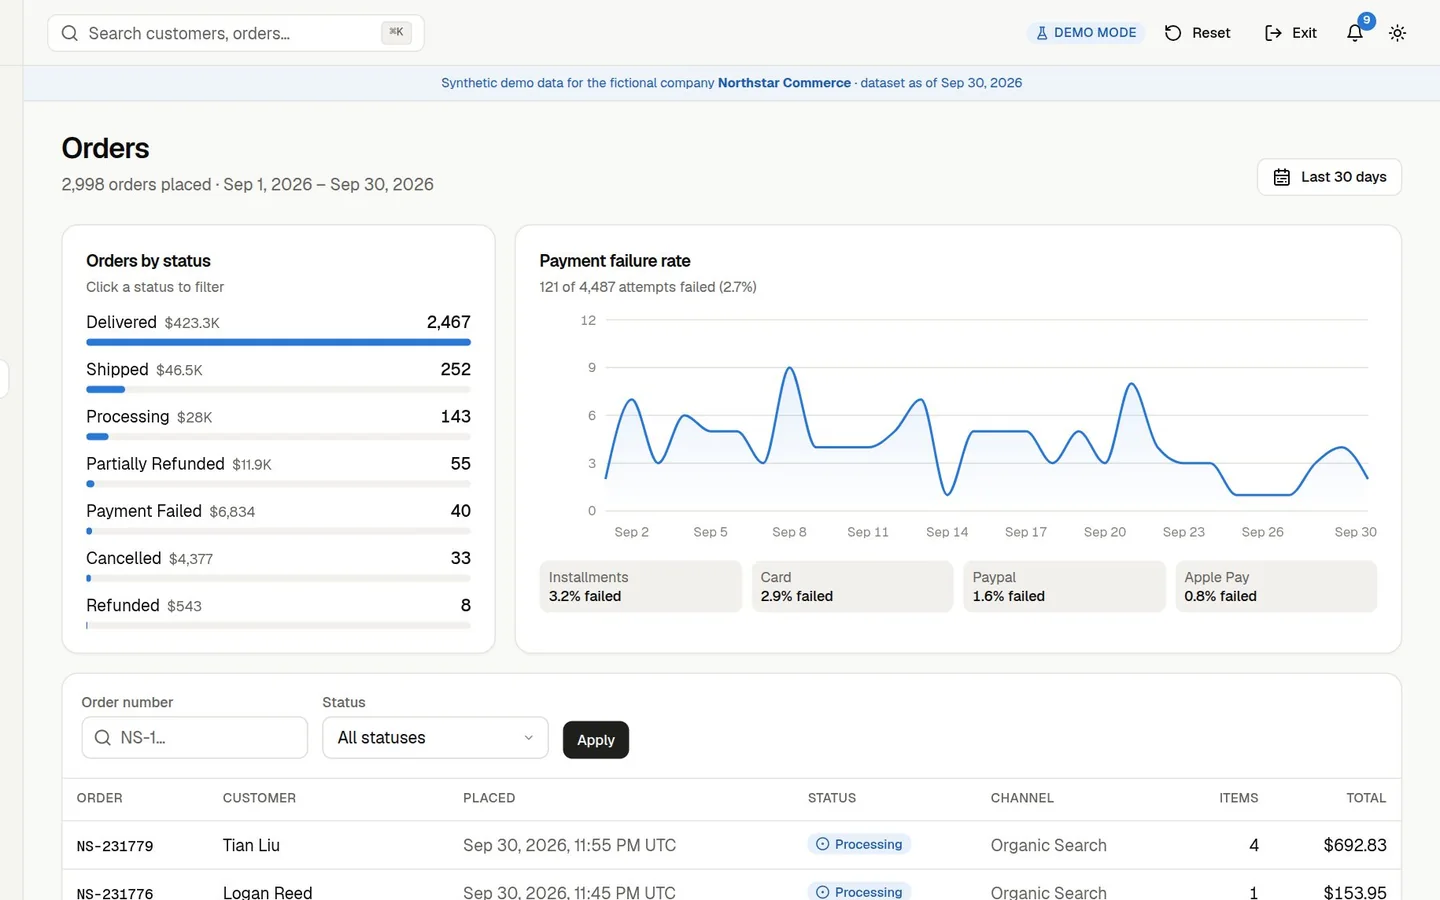
Pulse Orders page with orders by status, a payment failure rate chart and a filterable list of orders
Orders by status and payment failures
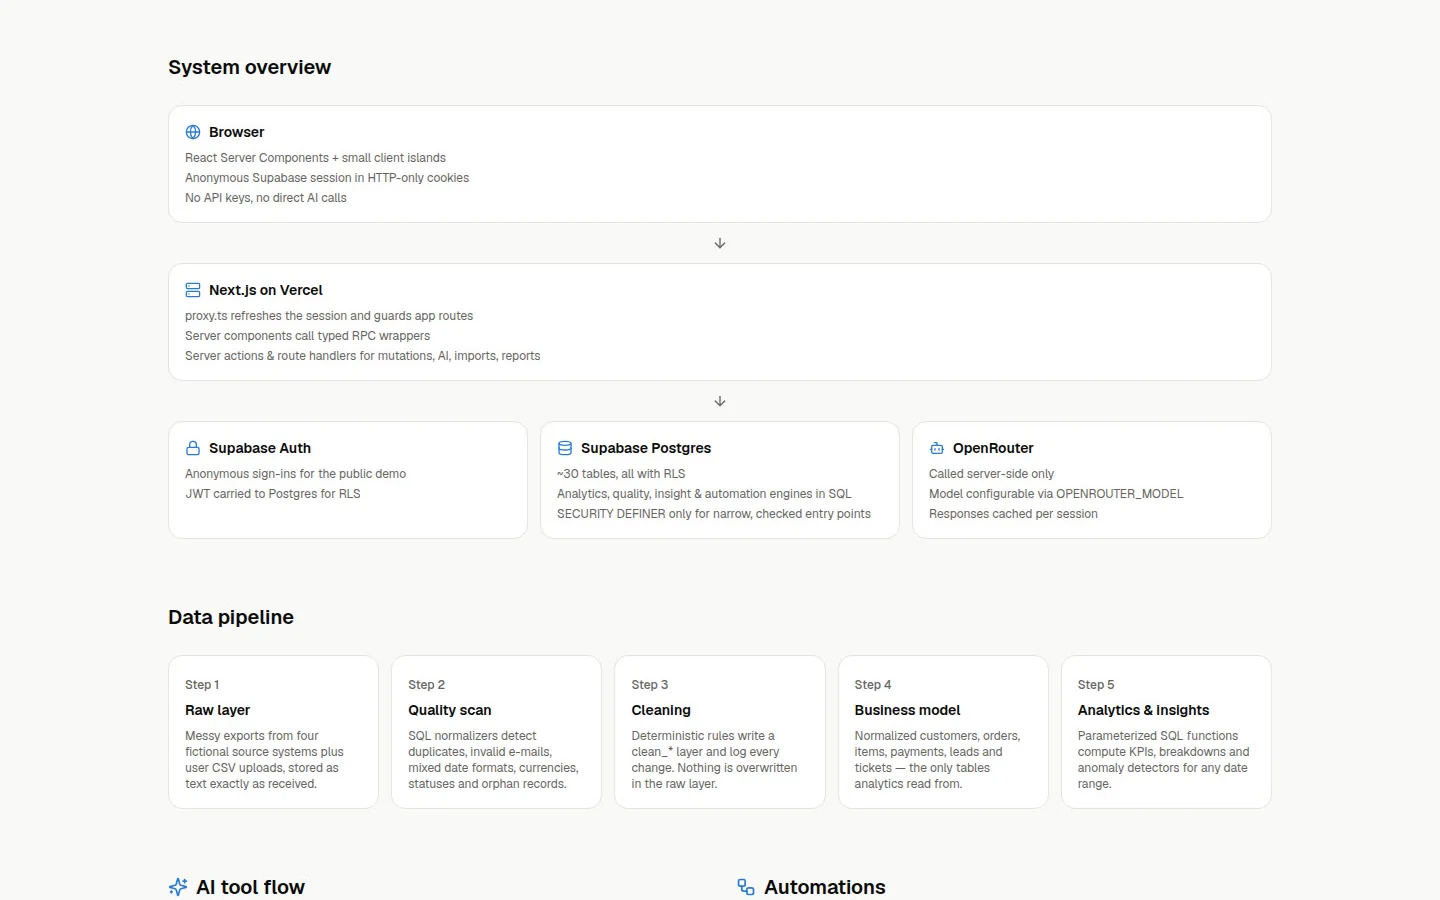
Pulse architecture page showing the browser, Next.js on Vercel, Supabase Auth, Supabase Postgres and OpenRouter, then the five step data pipeline
How it is put together
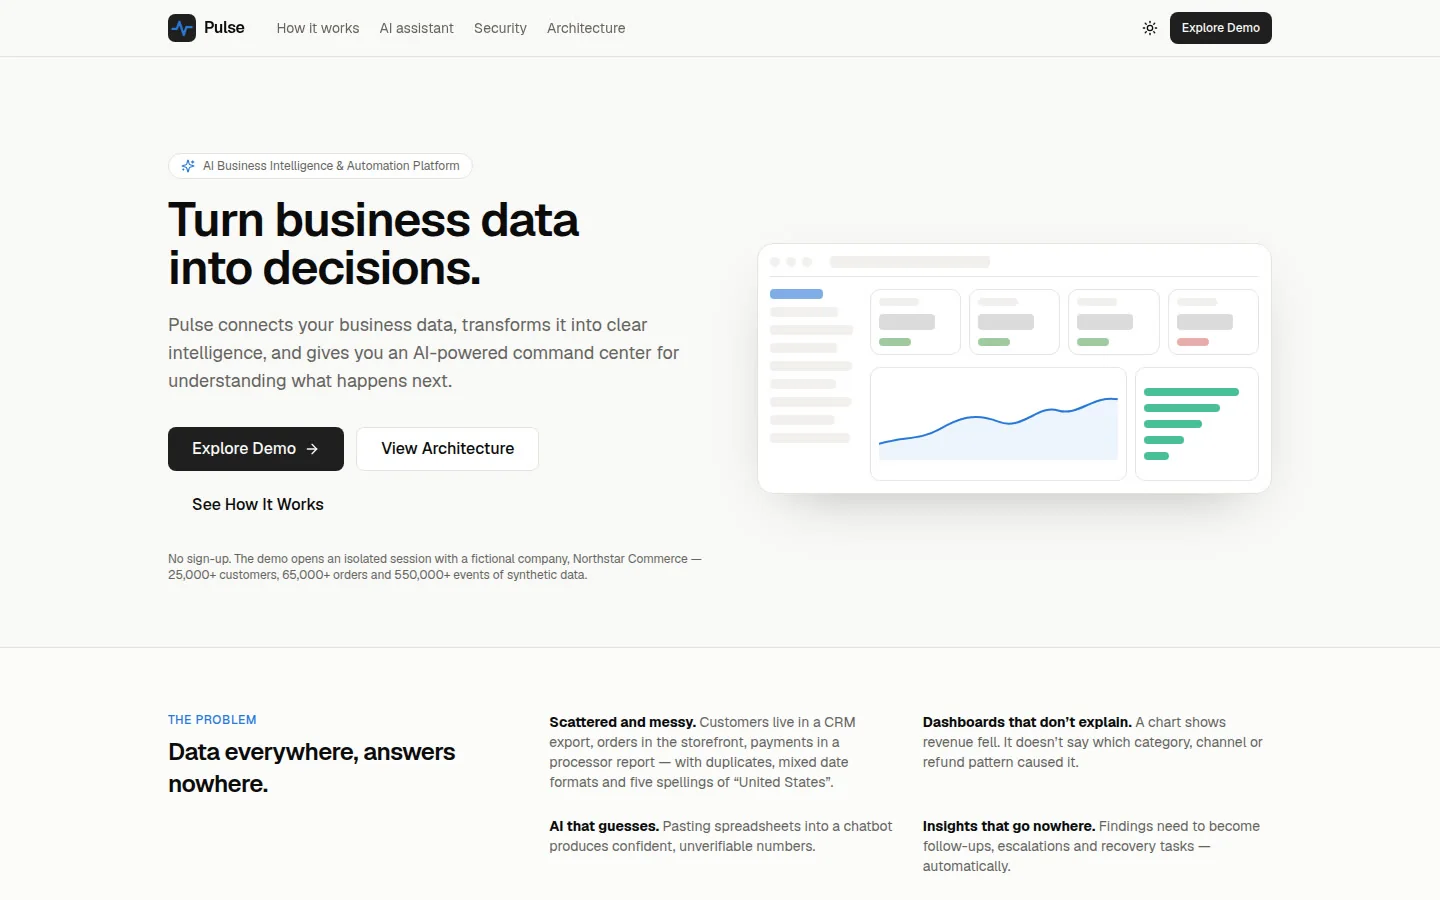
Pulse landing page with the heading Turn business data into decisions and buttons to explore the demo or view the architecture
The landing page
Let us work together

Is there something you are still doing by hand?

Tell me what the job is and I will tell you honestly whether it is worth building. Free 30 minute call, no pressure.

Book a 30 minute call

Tell me what the job is and I will tell you honestly whether it is worth building. Free 30 minute call, no pressure.

Open my calendar